For a certain company, the monthly percentages of all shipments received on time over the past 12 months are 80, 82, 85, 83, 84, 84, 85, 85, 82, 83, 85, and 83. (a) Construct a time series plot. о Monthly Percentage 86 86 MMMM 86 85 84 83 82 81 80 79 78 77+ + 0 1 2 3 4 5 678 9 10 11 12 13 Month 86 85 85 84 84 83 83 82 82 81 81 81 80 80 80 79 79 79 78 78 78 77 77 77 0 1 2 3 4 5 6 7 8 9 10 11 12 13 Month 0 1 2 3 4 5 6 7 8 9 10 11 12 13 Month 0 1 2 3 4 5 6 7 8 9 10 11 12 13 Month What type of pattern exists in the data? ○ The first two points may be an indication of a shift to a new level, but overall the time series plot exhibits a cyclical pattern. Overall, the time series plot exhibits a consistent trend pattern. 00000 The first two points may be an indication of a shift to a new level, but overall the time series plot exhibits a seasonal pattern. The first two points may be an indication of a shift to a new level, but overall the time series plot exhibits a horizontal pattern. The last two points may be an indication of a shift to a new level, but overall the time series plot exhibits a horizontal pattern. (b) Compare a three-month moving average forecast with the exponential smoothing forecast for a = 0.1. Compute the MSE for the three-month moving average forecast. (Round your answer to two decimal places.) Compute the MSE for the exponential smoothing forecast for α = 0.1. (Round your answer to two decimal places.) Which provides more accurate forecasts using MSE as the measure of forecast accuracy? ○ An exponential smoothing forecast with a = 0.1 provides the most accurate forecast using MSE. Both forecasts provide the same level of accuracy using MSE. ○ A 3-month moving average provides the most accurate forecast using MSE. (c) Using the more accurate forecast, what is the forecast for next month? (Round your answer to two decimal places.)
For a certain company, the monthly percentages of all shipments received on time over the past 12 months are 80, 82, 85, 83, 84, 84, 85, 85, 82, 83, 85, and 83. (a) Construct a time series plot. о Monthly Percentage 86 86 MMMM 86 85 84 83 82 81 80 79 78 77+ + 0 1 2 3 4 5 678 9 10 11 12 13 Month 86 85 85 84 84 83 83 82 82 81 81 81 80 80 80 79 79 79 78 78 78 77 77 77 0 1 2 3 4 5 6 7 8 9 10 11 12 13 Month 0 1 2 3 4 5 6 7 8 9 10 11 12 13 Month 0 1 2 3 4 5 6 7 8 9 10 11 12 13 Month What type of pattern exists in the data? ○ The first two points may be an indication of a shift to a new level, but overall the time series plot exhibits a cyclical pattern. Overall, the time series plot exhibits a consistent trend pattern. 00000 The first two points may be an indication of a shift to a new level, but overall the time series plot exhibits a seasonal pattern. The first two points may be an indication of a shift to a new level, but overall the time series plot exhibits a horizontal pattern. The last two points may be an indication of a shift to a new level, but overall the time series plot exhibits a horizontal pattern. (b) Compare a three-month moving average forecast with the exponential smoothing forecast for a = 0.1. Compute the MSE for the three-month moving average forecast. (Round your answer to two decimal places.) Compute the MSE for the exponential smoothing forecast for α = 0.1. (Round your answer to two decimal places.) Which provides more accurate forecasts using MSE as the measure of forecast accuracy? ○ An exponential smoothing forecast with a = 0.1 provides the most accurate forecast using MSE. Both forecasts provide the same level of accuracy using MSE. ○ A 3-month moving average provides the most accurate forecast using MSE. (c) Using the more accurate forecast, what is the forecast for next month? (Round your answer to two decimal places.)

Practical Management Science
6th Edition
ISBN:9781337406659
Author:WINSTON, Wayne L.
Publisher:WINSTON, Wayne L.
Chapter11: Simulation Models
Section: Chapter Questions
Problem 60P: You are considering a 10-year investment project. At present, the expected cash flow each year is...

Related questions
Question
100%
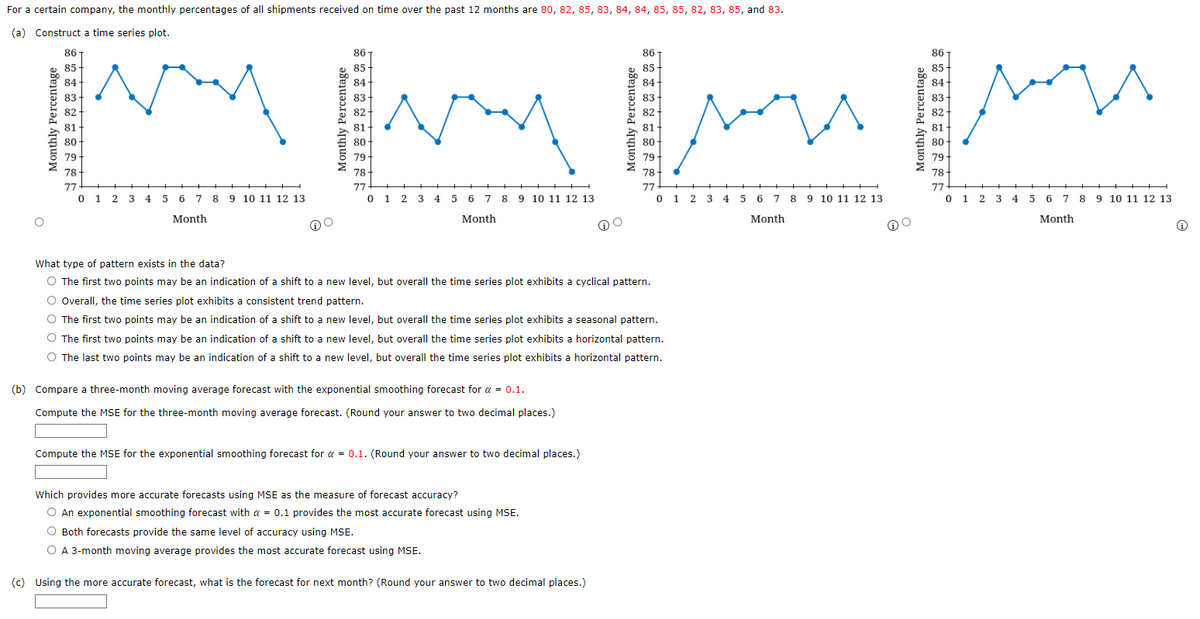
Transcribed Image Text:For a certain company, the monthly percentages of all shipments received on time over the past 12 months are 80, 82, 85, 83, 84, 84, 85, 85, 82, 83, 85, and 83.
(a) Construct a time series plot.
о
Monthly Percentage
86
86
MMMM
86
85
84
83
82
81
80
79
78
77+ +
0 1 2 3 4 5 678 9 10 11 12 13
Month
86
85
85
84
84
83
83
82
82
81
81
81
80
80
80
79
79
79
78
78
78
77
77
77
0
1 2 3 4 5 6 7 8 9 10 11 12 13
Month
0 1 2 3 4 5 6 7 8 9 10 11 12 13
Month
0 1 2 3 4 5 6 7 8 9 10 11 12 13
Month
What type of pattern exists in the data?
○ The first two points may be an indication of a shift to a new level, but overall the time series plot exhibits a cyclical pattern.
Overall, the time series plot exhibits a consistent trend pattern.
00000
The first two points may be an indication of a shift to a new level, but overall the time series plot exhibits a seasonal pattern.
The first two points may be an indication of a shift to a new level, but overall the time series plot exhibits a horizontal pattern.
The last two points may be an indication of a shift to a new level, but overall the time series plot exhibits a horizontal pattern.
(b) Compare a three-month moving average forecast with the exponential smoothing forecast for a = 0.1.
Compute the MSE for the three-month moving average forecast. (Round your answer to two decimal places.)
Compute the MSE for the exponential smoothing forecast for α = 0.1. (Round your answer to two decimal places.)
Which provides more accurate forecasts using MSE as the measure of forecast accuracy?
○ An exponential smoothing forecast with a = 0.1 provides the most accurate forecast using MSE.
Both forecasts provide the same level of accuracy using MSE.
○ A 3-month moving average provides the most accurate forecast using MSE.
(c) Using the more accurate forecast, what is the forecast for next month? (Round your answer to two decimal places.)
Expert Solution
This question has been solved!
Explore an expertly crafted, step-by-step solution for a thorough understanding of key concepts.

This is a popular solution!

Trending now
This is a popular solution!

Step by step
Solved in 2 steps with 1 images

Recommended textbooks for you
Practical Management Science
Operations Management
ISBN:
9781337406659
Author:
WINSTON, Wayne L.
Publisher:
Cengage,
Practical Management Science
Operations Management
ISBN:
9781337406659
Author:
WINSTON, Wayne L.
Publisher:
Cengage,