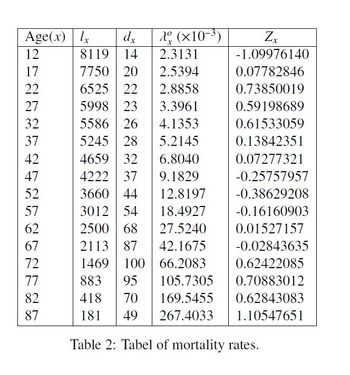
Age(x) lx 12 17 22 27 32 37 42 47 52 57 62 67785 72 dx 2 (x10-³) 2.3131 X 8119 14 7750 20 2.5394 6525 22 2.8858 5998 23 3.3961 5586 26 4.1353 5245 28 5.2145 4659 32 6.8040 4222 37 9.1829 3660 44 12.8197 3012 54 18.4927 2500 68 27.5240 2113 87 42.1675 1469 100 66.2083 883 95 105.7305 418 70 169.5455 181 49 267.4033 Table 2: Tabel of mortality rates. 82 Zx -1.09976140 0.07782846 0.73850019 0.59198689 0.61533059 0.13842351 0.07277321 -0.25757957 -0.38629208 -0.16160903 0.01527157 -0.02843635 0.62422085 0.70883012 0.62843083 1.10547651 3. The life Table 2 a three-parameter Poisson model. provides an estimate of mortality rates obtained from (a) Perform statistical tests (²-test, standardized deviations test, sign test, change- of-sign test, and grouping-of-sign test) on the quality of goodness-of-fit of the Poisson model.
Age(x) lx 12 17 22 27 32 37 42 47 52 57 62 67785 72 dx 2 (x10-³) 2.3131 X 8119 14 7750 20 2.5394 6525 22 2.8858 5998 23 3.3961 5586 26 4.1353 5245 28 5.2145 4659 32 6.8040 4222 37 9.1829 3660 44 12.8197 3012 54 18.4927 2500 68 27.5240 2113 87 42.1675 1469 100 66.2083 883 95 105.7305 418 70 169.5455 181 49 267.4033 Table 2: Tabel of mortality rates. 82 Zx -1.09976140 0.07782846 0.73850019 0.59198689 0.61533059 0.13842351 0.07277321 -0.25757957 -0.38629208 -0.16160903 0.01527157 -0.02843635 0.62422085 0.70883012 0.62843083 1.10547651 3. The life Table 2 a three-parameter Poisson model. provides an estimate of mortality rates obtained from (a) Perform statistical tests (²-test, standardized deviations test, sign test, change- of-sign test, and grouping-of-sign test) on the quality of goodness-of-fit of the Poisson model.
Oh no! Our experts couldn't answer your question.
Don't worry! We won't leave you hanging. Plus, we're giving you back one question for the inconvenience.
Submit your question and receive a step-by-step explanation from our experts in as fast as 30 minutes.
You have no more questions left.
Message from our expert:
Our experts are unable to provide you with a solution at this time. Try rewording your question, and make sure to submit one question at a time. We've credited a question to your account.
Your Question:
Please do the following questions with handwritten working out

Transcribed Image Text:Age(x) lx
12
17
22
27
32
37
42
47
52
57
62
67785
72
dx
2 (x10-³)
2.3131
X
8119 14
7750 20
2.5394
6525 22 2.8858
5998 23 3.3961
5586 26
4.1353
5245 28 5.2145
4659 32
6.8040
4222 37 9.1829
3660 44
12.8197
3012 54
18.4927
2500 68 27.5240
2113 87 42.1675
1469 100 66.2083
883 95
105.7305
418 70 169.5455
181 49 267.4033
Table 2: Tabel of mortality rates.
82
Zx
-1.09976140
0.07782846
0.73850019
0.59198689
0.61533059
0.13842351
0.07277321
-0.25757957
-0.38629208
-0.16160903
0.01527157
-0.02843635
0.62422085
0.70883012
0.62843083
1.10547651

Transcribed Image Text:3. The life Table 2
a three-parameter Poisson model.
provides an estimate of mortality rates obtained from
(a) Perform statistical tests (²-test, standardized deviations test, sign test, change-
of-sign test, and grouping-of-sign test) on the quality of goodness-of-fit of the
Poisson model.
Recommended textbooks for you

Big Ideas Math A Bridge To Success Algebra 1: Stu…
Algebra
ISBN:
9781680331141
Author:
HOUGHTON MIFFLIN HARCOURT
Publisher:
Houghton Mifflin Harcourt

Glencoe Algebra 1, Student Edition, 9780079039897…
Algebra
ISBN:
9780079039897
Author:
Carter
Publisher:
McGraw Hill

Calculus For The Life Sciences
Calculus
ISBN:
9780321964038
Author:
GREENWELL, Raymond N., RITCHEY, Nathan P., Lial, Margaret L.
Publisher:
Pearson Addison Wesley,

Big Ideas Math A Bridge To Success Algebra 1: Stu…
Algebra
ISBN:
9781680331141
Author:
HOUGHTON MIFFLIN HARCOURT
Publisher:
Houghton Mifflin Harcourt

Glencoe Algebra 1, Student Edition, 9780079039897…
Algebra
ISBN:
9780079039897
Author:
Carter
Publisher:
McGraw Hill

Calculus For The Life Sciences
Calculus
ISBN:
9780321964038
Author:
GREENWELL, Raymond N., RITCHEY, Nathan P., Lial, Margaret L.
Publisher:
Pearson Addison Wesley,
